8 essential wholesale metrics to track
In this blog, check out eight essential wholesale metrics you should start tracking today and how they’ll impact your bottom line.
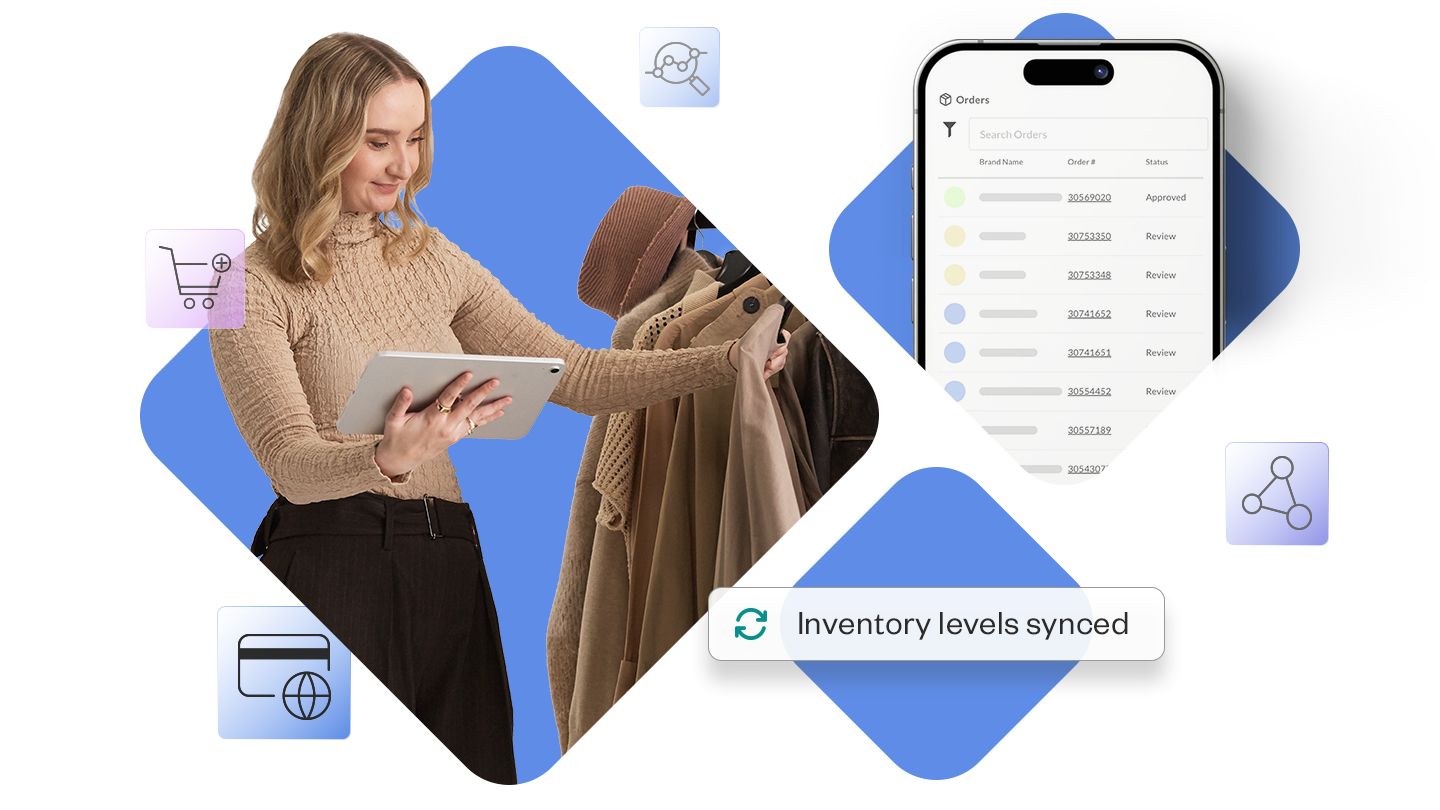
Real-time wholesale data is essential for managing your inventory, your production plans, and your sales strategy. But where does that data come from? And which specific metrics offer the insights you need to improve your sales? Let’s look at the eight essential wholesale metrics you can start tracking with NuORDER —and how they’ll impact your bottom line.
Pre-season metrics
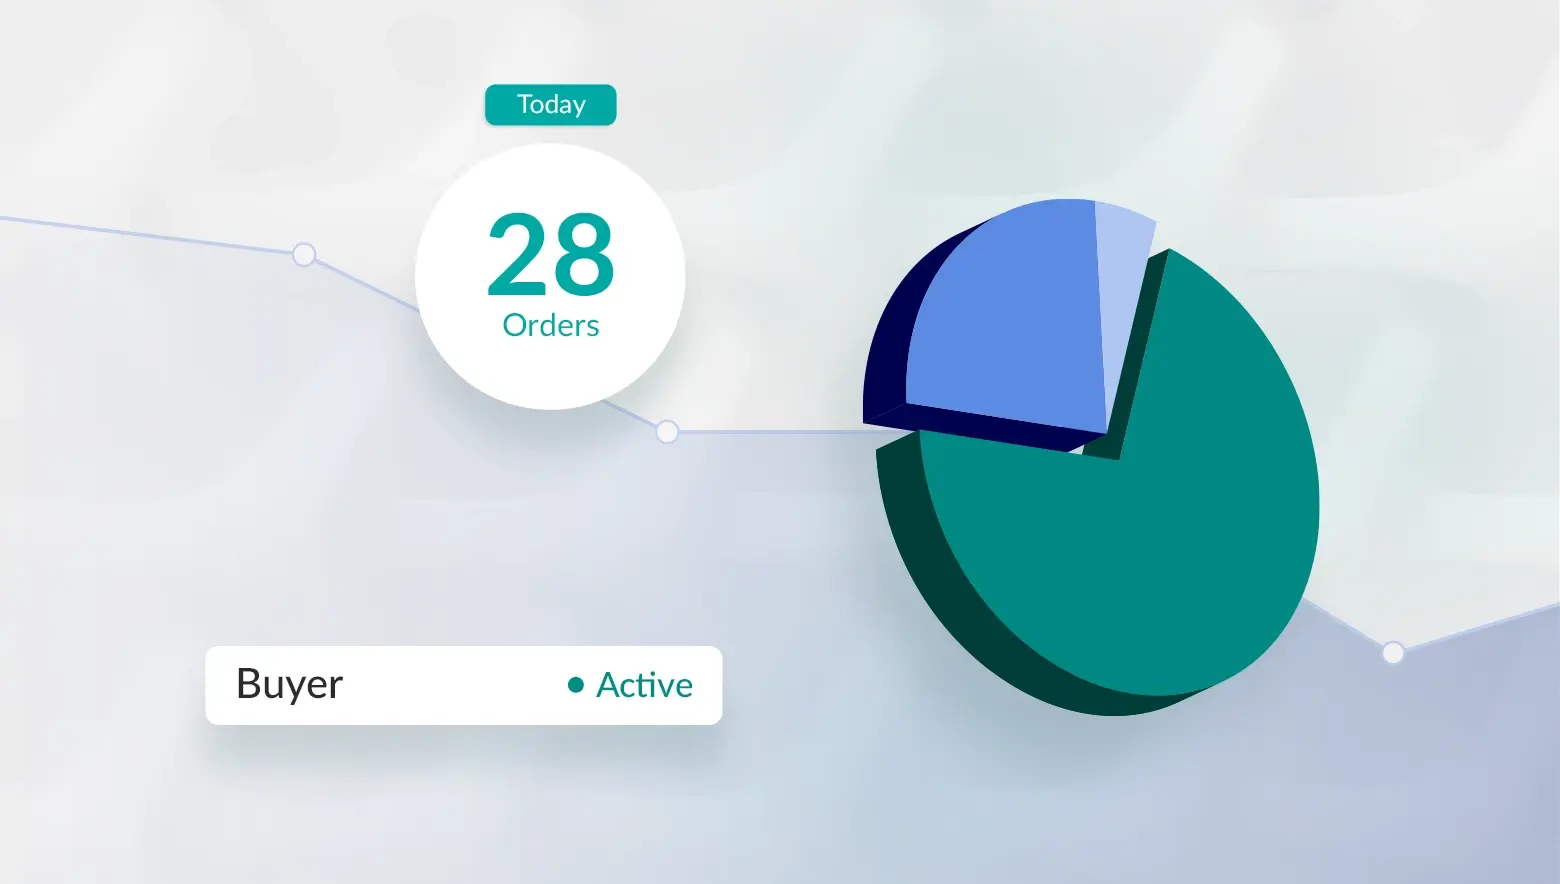
#1: Buyer activity report
Run a buyer activity report and you’ll know:
- When the buyer last logged in
- When they last ordered (and total order value)
- Which linesheets they viewed
This is perfect for lull periods because you can retarget buyers who haven’t re-engaged yet. “You can pull reports on your existing clientele to see who hasn't re-engaged with your brand and then you can actively send out campaigns or line sheets or PDFs to these users maybe offering them a discount or incentive off their next order,” says Chelsie Frieze, Director of Customer Success at NuORDER.
In other words, you can use NuORDER to find ways to make your existing buyers more likely to stick around.
#2: Orders by season by company report
Brands need a year-by-year comparison to see if this season was as good as your last. Are you underperforming? Overperforming? When you know what to expect during the current buying season, you can improve the accuracy of your production and inventory forecasts.
The key to using this metric: look at how many units or dollars each company bought from you in previous seasons, then average it out. You can then create season-to-season comparisons and plan for inventory allocation in the future.
#3: Available-to-sell (ATS) report
Frieze called these reports “amazing,” thanks to the comprehensive PDFs you can create with NuORDER. Buyers and reps can log in and view an ATS report at any time, accessing the full collection of ATS products. In essence, there’s no inventory guesswork.
In NuORDER, the ATS reporting uses visual templates you can customize, so it’s simple for anyone who isn’t tech-savvy to view. A salesperson who needs to know which products are available to sell can access the ATS report anywhere, anytime.
In-season metrics
#4: Top 20 bestsellers (who didn’t buy) report
During the season, you need to know what’s selling. In NuORDER you can view your top 20 trending styles by color and cost. You can pull the report to curate a custom list with the bestselling styles, then send it out to highlight your top 20 bestsellers of the season.
Next, use this information to create a linesheet for buyers. After all, they want to know what’s selling, too. They can use that information to market those styles to their buyers.
#5: Daily order log report
This log lets you view the orders already placed. You’ll know at a glance whether you’re on track to meet your inventory needs and achieve your goals.
Frieze notes Daily Order Log reports are particularly well-received in the U.S., sales reps that attend trade shows like to review how much additional money they’ve earned at an event. There’s no need to pull out the calculator—the report runs it all, including daily tracking of KPIs.
#6: Illustrated buys-by-company report
“Here’s why data and reporting is so crucial,” says Frieze. “It identifies trends or patterns.” With the Buys-by-Company report, you can view which products are selling the most to the same company. The report creates a visual accounting of what each buyer has ordered. Use it with past orders to see what your buyers have already purchased to identify upsell opportunities.
Is a buyer really invested in tops with bright colors? If you had similar products in a later season, you can save that information, start suggesting units to the customer, and use these same reports to create forward projections of sales throughout the year.
Post-season metrics
Buyer activity report
Bring back the buyer activity report to ensure all the accounts you met with during the previous season are placing orders for the new season. You’ll have your bearings on inventory in anticipation of next year’s seasons.
#7: Production: Units by style, color, and size report
Forecasting future sales isn’t just about looking at previous numbers. It’s about identifying the color and style trends that could reshape your inventory for next season. What’s popular? What’s selling? Use this production report to forecast stock allocations for the next season.
#8: Sales history by rep, month, and company report
Which rep drove the most business? This is a question any manager needs to know. “You can also maybe do a little bit of healthy competition,” says Frieze. “If you’re seeing someone is performing really well, you might want to incentivize them.”
This report pulls total sales per sales rep, even creating a simple bar graph layout so it’s available at a moment’s glance. Not every company can review where the most orders are coming from so easily, which is why this report is invaluable for identifying what’s working, and where to incentivize more sales for next season.
Using each season to fuel the next
It doesn’t matter what point you may be at during the buying season: with NuORDER, there’s always a report you can run to identify what you need, find what’s working, cut back on what’s not working, and double down on the bestsellers. You can use each season to fuel next season’s projections. Only this time, your inventory will be ready.
Share article
Related articles
Get on the list
Wholesale tips and industry news you can’t miss, delivered weekly