Learn which eCommerce metrics actually drive B2B wholesale growth, how to calculate each one, and how to utilize KPIs for real impact.
One of the greatest challenges in the realm of eCommerce is that most sellers feel as if they have access to far more data than anyone could ever possibly sift through or make sense of. However, the goal isn’t to use or pay attention to every metric on your screen. Instead, it’s important to focus on the key performance indicators (KPIs) that matter most for you and your business.
It can be tempting to hone in on vanity figures like impressions, traffic, and followers, but there are far more useful eCommerce metrics to watch—including the numbers surrounding your order data. Use this B2B guide to identify the most important metrics, the roles they play along the buying journey, formulas to make sense of them, and guidance on how to use them to take concrete action.
KPIs and eCommerce metrics are two different things; every KPI is a metric, but not every metric is a KPI.
In B2B eCommerce, performance matters most.
Never over-index on any one step of the buyer’s journey—track key metrics along the way.
Each quarter, leverage a strategic selection of eCommerce metrics to improve the health of your wholesale business.
Learn how to skip common mistakes and improve the most important metrics in B2B sales.
eCommerce metrics are specific, measurable performance values you can reference to track the performance of your wholesale business. Each metric identifies and pertains to a specific leg of the buying journey. For example, conversion rates give insights into purchasing behavior and retention rates shed light on the loyalty of your wholesale customers. Use eCommerce metrics to set goals, justify spend, report to stakeholders, and identify underperformance with enough time to turn things around.
Even though every KPI is a metric, not every metric represents a KPI. For instance, average order value (AOV) is a metric, but it’s not a KPI. However, it would represent a KPI if it were something specific such as “increase AOV to $5,000 by Q4.” One of the biggest mistakes wholesale eCommerce companies make is using far too many KPIs to measure their success. Track many metrics for general context—but only use a few of those metrics to develop KPIs.
While performance-based B2B eCommerce metrics are certainly important in B2C channels, they hold far more weight when it comes to B2B sales. That primarily comes down to the inherent differences between B2B and B2C sales. Specifically, B2B encompasses larger order values, longer sales cycles, predictable reorder cadences, and the vast majority of revenue tends to come from a small percentage of wholesale accounts (The 80/20 Rule). When you examine these key differentiators, it becomes clear that performance metrics are key. In B2B, choose KPIs that will help you grow retention and encourage more reorders of greater order values. Also pay attention to KPIs as they pertain to your most valuable accounts—they’ll often be far more useful than simply attempting to grow order values across your entire portfolio of clients.
Your overall B2B eCommerce traffic and conversion rates still matter, it’s just important not to give them the same weight as deeper, more strategic metrics.
For various reasons, you might be tempted to focus on some eCommerce metrics over others, but if you do, you could miss valuable feedback concerning different stages of the buying journey. No matter which KPIs you choose, be sure to choose a selection that represents each stage of the buying journey. This will help you focus on important eCommerce metrics without overindexing on any one stage.
In this section, we’ll take a closer look at key metrics from every stage, as well as their formulas and primary significance.
-1.webp?width=1919&height=828&name=Customer%20Retention%20Rate%20(CRR)-1.webp)
Your conversion rate is a useful way to determine how many of your B2B eCommerce visitors are actually placing orders. If your conversion rate is lower than you expected, that might not be the entire story. Remember that a low conversion rate on high-value wholesale orders can be far better than a high conversion rate on orders with low AOV. Get a clear picture of what’s actually happening in your business by segmenting by account type.
-1.webp?width=1919&height=828&name=Average%20Order%20Value%20(AOV)-1.webp)
AOV can tell you a lot about the efficacy or viability of your volume pricing and minimum order quantities (MOQ). They can also shed light on the highest-grossest assortments of curations which could help inform the production of future collections. It’s also important to note that if your AOV is too low, you could end up with razor-thin margins.
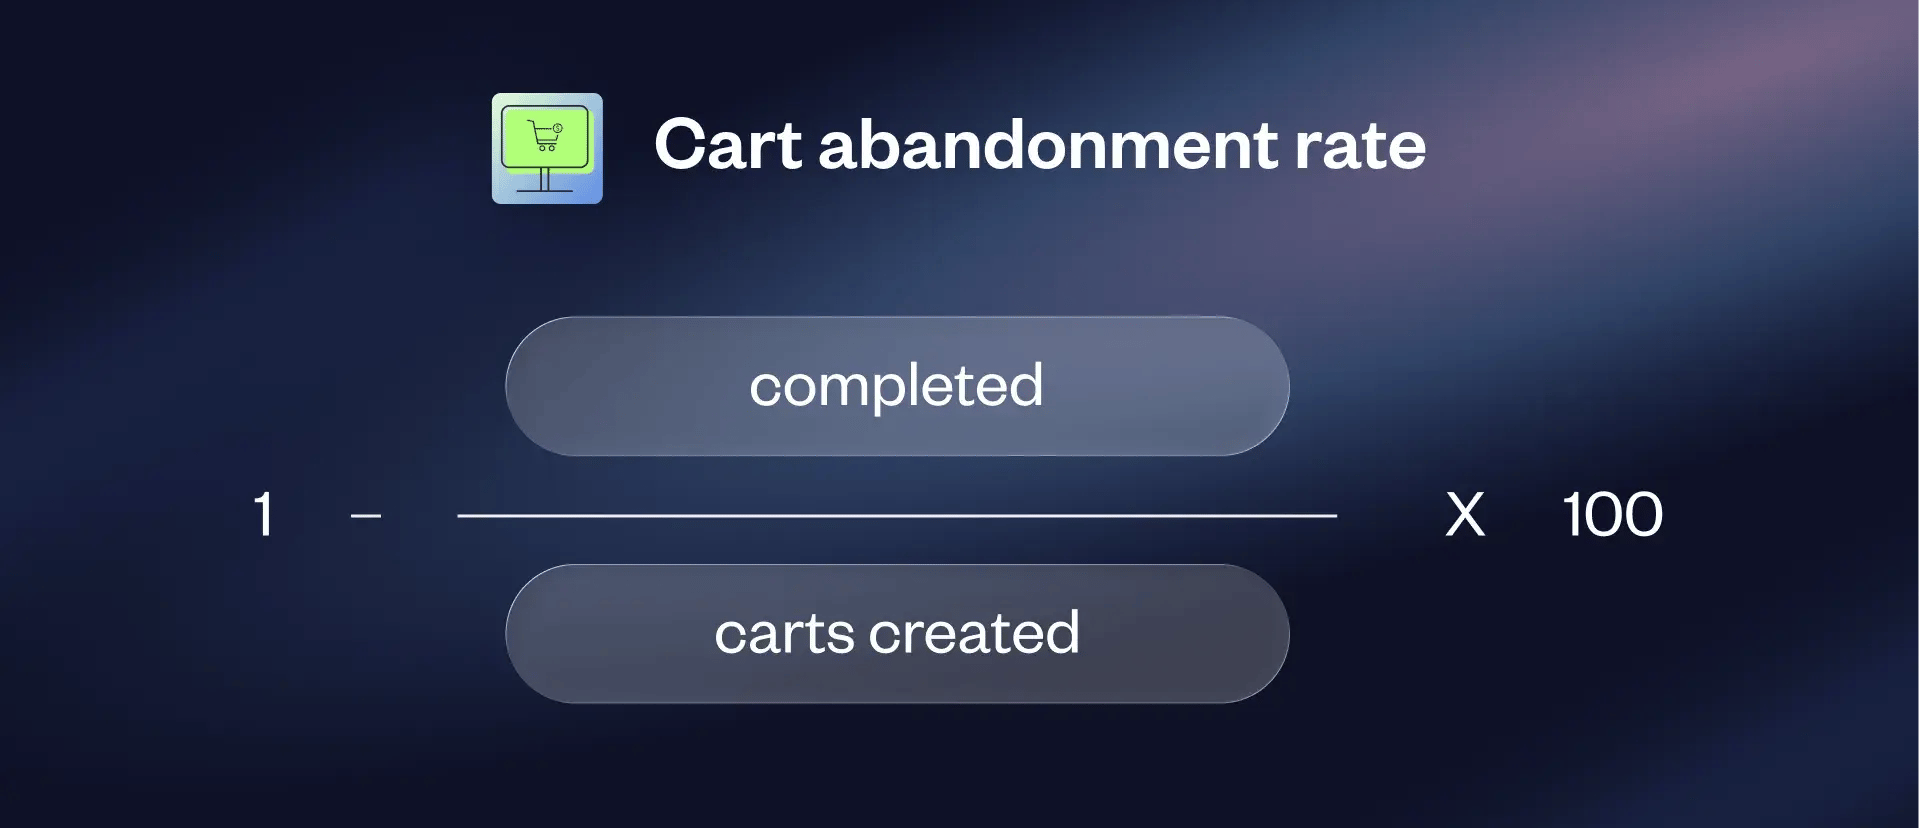
If a merchant abandons their shopping cart, it can help you identify any account-specific friction that might be happening behind the scenes. For example, they might not be able to see vital inventory information (such as quantities and colorways). Or their account-specific terms and negotiated pricing might be missing.
-1.webp?width=1919&height=828&name=Customer%20Acquisition%20Cost%20(CAC)-1.webp)
Track how much it costs you to acquire new customers, your CAC, by each marketing and sales channel to maintain clarity. And while it can be tempting to solely opt for low-cost acquisition methods, it’s important to be wary of any low CAC channels that result in a high rate of early churn (thus becoming a great expense).
-1.webp?width=1919&height=828&name=Return%20on%20Ad%20Spend%20(ROAS)-1.webp)
One of many reasons why a business might generate significant revenue while demonstrating very little profitability is that they’re investing far too much money on advertising. Conversely, generating $4 of revenue for every dollar you spend on advertising is a widely accepted standard that makes the expense worthwhile. Also monitor your customer lifetime value (CLV): CAC ratio; 3:1 is a widely accepted, healthy target. It means the customer spends $3 for every $1 you spent to acquire them. The CLV formula is featured in the section below.
.webp?width=1919&height=828&name=Customer%20lifetime%20value(CTV).webp)
Customer lifetime value is the most important metric in B2B sales. It can be all too easy to get caught up in short-term success while operating with very little clarity about the future. However, CLV (also known as LTV) is a great tool for getting a visual on short-term and long-term success. As briefly mentioned in the section above, you can also use CLV to strategically adapt your customer acquisition spend.
-1.webp?width=1919&height=828&name=Customer%20Retention%20Rate%20(CRR)-1.webp)
Compounding wins can do a lot to elevate the health and prosperity of your wholesale business—both today and in the long run. One way to earn compounded gains? Retain your customers for a longer period of time. Yes, those years of business add up, but retained accounts also tend to increase their order values over time.
Note: For the purposes of the CRR formula, Ending Customers refers to all active customers within a specific timeframe and New Customers refers to any new customers you acquired within that timeframe.
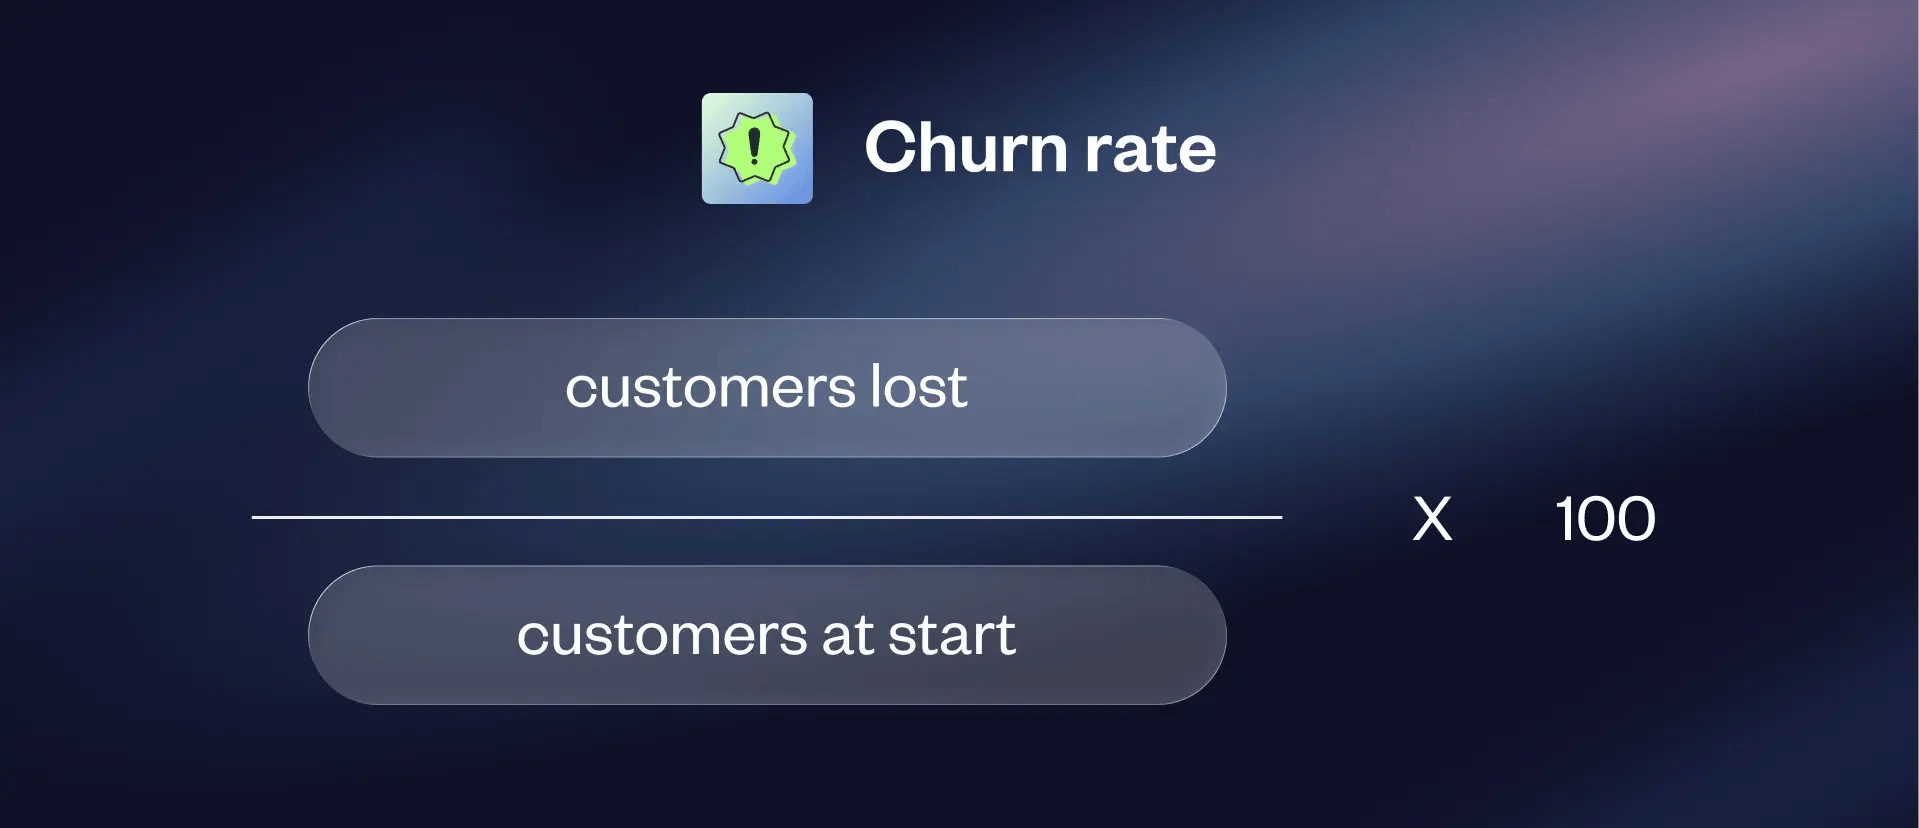
If you offer buyers standing orders or subscription-style orders they receive on a regular basis, it’s critical to understand your churn rate. If you’re losing customers too quickly or if buyers are opting out of these auto-replenished orders at a rapid rate, it’s important to find out as soon as possible so you can find out what’s inspiring churn to turn things around.
The metrics that are actually the most powerful predictors of wholesale revenue rarely enter the spotlight. These B2B-specific metrics are: reorder rate, average order frequency, AOV by account tier, and sell-through rate. Your reorder rate is how often your accounts are ordering more from your business, and it’s one of the earliest signs of churn. Average order frequency is how often buyers place orders with you. AOV by account tier shows you the average value of an order on an account by account basis; for instance, Retailer ABC123 has an AOV of $50,000. Sell-through rate tells you what percentage of the items you sell are actually purchased.
These four metrics connect sales, marketing, and operations to give you sophisticated, well-rounded insights into your business.
Make sure your teams understand and agree with the same definitions for all of these eCommerce metrics to promote accurate and clear reporting.
|
Metric |
Formula |
What It Tells You |
|---|---|---|
|
Conversion Rate |
(Orders ÷ Visitors) × 100 |
How effective your wholesale eCommerce presence is at making a sale |
|
Average Order Value |
Revenue ÷ Orders |
Revenue captured per order |
|
Cart Abandonment Rate |
(1 − (Purchases ÷ Carts)) × 100 |
Friction at checkout |
|
Customer Acquisition Cost |
Sales & Marketing Spend ÷ New Customers |
Cost to win one account |
|
Return on Ad Spend |
Ad Revenue ÷ Ad Cost |
Profitability of advertising spend |
|
Customer Lifetime Value |
AOV × Frequency × Lifespan |
Total value of an account |
|
Customer Retention Rate |
((End − New) ÷ Start) × 100 |
Loyalty over a specified period |
|
Reorder Rate |
Repeat-ordering Accounts ÷ Total Accounts |
B2B repeat-purchase health |
Tracking only represents half of the effort. The most important thing you can do is analyze what the numbers above indicate to make material changes and get better results.
Improve conversions: Ensure your inventory is accurately represented, improve the quality of your images, and ensure every SKU includes key ordering information. And if all of that information is available, take some time to think about what you have on offer. For instance, maybe your shipping windows are longer than usual or your MOQ is prohibitively high for your particular category. Also save buyers’ past orders so they can quickly remind themselves of their past selections to make faster, better-informed decisions.
Increase AOV: Make relevant replenishment suggestions throughout the season to encourage reorders. Consider selling some or all of your goods for less when buyers meet certain volume pricing thresholds. Present custom-tailored assortments to key retailers to help them meet their customers’ desires or needs with relevant upselling and cross-selling opportunities.
Reduce abandoned carts: Make sure buyers have easy access to their account-specific pricing and terms. Ensure all of your SKUs feature all relevant information. Offer one-click reorder, shoppable linesheets, and other conveniences to reduce manual steps. Also use your wholesale platform to set up automated abandoned cart reminders.
Reduce your CAC: Identify your most effective customer-acquisition channels, then focus your efforts there to maximize your efforts. Develop a customer referral strategy and offer enticing incentives. If your wholesale platform has a built-in marketplace, take advantage of the opportunity to be discovered by potential new accounts. Reducing your CAC is an excellent path to increasing your profitability.
Increase your return on ad spend: Identify your most effective advertising channels, then focus your efforts there. Mind your ad spend to acquisition ratio.
Increase reorder rate, customer retention rate, and CLV: Contact buyers proactively before it’s time for them to reorder (such as through email campaigns featuring custom-tailored assortments). Stay in touch between market weeks and explore ways to strengthen your relationship with retailers.
You’ll often find opportunities to make the greatest impact when you make decisions or changes that impact marketing, operations, and sales. Make it a cross-departmental effort.
Still, as important as the eCommerce metrics are, focus is key. Define your most top goal for this quarter, then choose 3-5 metrics to focus on. If you set too many KPIs, you can end up undermining your efforts and missing critical insights.
This also bears repeating: ensure marketing, sales, and operations are all up to speed and that they share the exact definitions for each eCommerce metric. This will help you save time and avoid confusion when different teams start to create reports. Use your wholesale platform to automate data pulls and review them on a regular cadence.
It’s far better to leverage five trusted metrics pulled from reliable data than 30 metrics that are largely ignored.
When you create a review cadence for your target metrics for the quarter, set up the cadence to align with how fast the number actually changes. For example, it’s a good idea to set up a weekly cadence for operational metrics, such as conversion rate and cart abandonment rate. However, a monthly or quarterly cadence would be more appropriate for slow-moving metrics, such as retention rate, reorder rate or frequency, and CLV. When you establish the right cadence, you’ll resist the natural temptation to overreact to slow-moving metrics. You can also avoid checking fast-changing metrics too late. Set them up as repeating events in your calendar.
Avoid these common B2B eCommerce metric mistakes.
|
Common mistake |
What to do instead |
|
Tracking everything and acting on nothing |
Choose your KPIs deliberately. Focus on the metrics that directly support your business goals and inform decision-making. |
|
Measuring acquisition while ignoring retention |
Remember that the long-term health of your business depends on the compounding value of reorders from retained accounts—not just new customer acquisition. |
|
Reading numbers in isolation |
Always consider metrics in context. For example, a declining conversion rate may be acceptable if your average order value (AOV) and reorder rates are increasing. |
|
Letting data live in disconnected tools |
Use a wholesale platform that integrates data across your tech stack. A connected system provides reliable, consistent data you can trust to make better decisions. |
When you leverage the right eCommerce metrics in strategic ways, you can take your wholesale eCommerce business to another level by making meaningful changes, better-informed decisions, and moves that entice merchants to buy deeper into your account. The right wholesale platform can help you make it happen. That’s why NuORDER unifies orders, accounts, and performance so the right metrics with the trusted, reliable data surface for you automatically.
Wholesale tips and industry news you can’t miss, delivered weekly